
| DOWNLOAD PDF |
Richard L Gregory, Priscilla Heard
From: Perception, 1979, volume 8, pages 365-380 with the kind permission of the Editor
Brain and Perception Laboratory, University of Bristol, Department of Anatomy. The Medical School. University Walk, Bristol BS8 1TD. England
Abstract
The Cafe Wall illusion (seen on the tiles of a local café) is a Münsterberg chequerboard figure, but with horizontal parallel lines which may have any luminance separating the rows of displaced squares. Thcsc (these 'mortar' lines) display marked wedge distortion which is especially affected by: contrast of the squares ('tiles'; width of the 'mortar' lines, and their luminance which must not be significantly higher than that of the light squares or lower than that of the dark squares for distortion to occur. An experiment is described from which quantitative data have been obtained by varying these parameters. It is suggested that contiguous regions of different luminance (and contiguous colour regions) are normally held in spatial register by locking from common luminance boundaries. The Café Wall illusion is attributed to this border locking producing inappropriate contour shifts from neighbouring regions of contrasting luminance when separated by narrow gaps of neutral luminance. Further implications on the border-locking notion are discussed.
1 Introduction
1 .1 Background
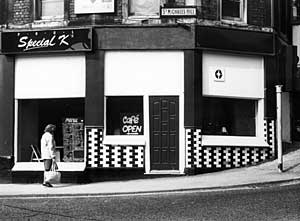
Figure 1. The original of the Café Wall, St Michael's Hill, Bristol.
It was noted some time ago (Gregory 1973) by a then member of our laboratory, Steve Simpson, that the mortar lines of the chessboard-like design of tiles of a café wall in St Michael's Hill, near our laboratory in Bristol, appear not parallel as they are, but to converge markedly in alternate-direction wedges (figure 1). We made models of similar patterns in which several parameters could be controlled, especially luminance contrast of the 'tiles', colour of the 'tiles', and their rectilinear proportions; and the width, the colour and the luminance of the parallel 'mortar' lines. Hundreds of subjects were shown these models, mainly in the informal setting of lecture demonstrations, while we got a feel for the phenomena which were striking and remarkably consistent. It was at once noted that most of the effects persisted, or changed in repeatable, consistent ways, over a very wide range of viewing conditions. So there were clearly 'hard' data to be extracted. The basic figure of a chessboard with alternate rows of squares shifted by half a cycle is the Münsterberg figure (figure 2).
Figure 2. The Münsterberg figure.
By our term 'Café Wall' illusion we refer to the much more general case, especially where the 'mortar' lines may have a luminance different from either the light or dark 'tiles'. It turns out that the parallel black lines of the Münsterberg figure, in which the dark squares ('tiles') are also black, is a special and limiting case; it does not reveal several features of interest in this unusual distortion illusion, in which all lines are parallel or at right angles, and the figure is essentially symmetrical though the evoked distortion is markedly asymmetrical.
From these informal though rather extensive observations by many observers several 'laws' emerged.
1.2 'Laws' of the Café Wall illusion
(i) The alternate wedge distortions occur in the same directions, at all times, for all observers under the same viewing conditions; and for all observers the wedge distortions reverse when alternate rows of tiles are pushed across half a cycle.
(ii) The distortion remains in the same direction for a wide range of shift of the alternate rows: there is no sudden switch of wedge direction when alternate rows are shifted across the bisection, as might have been expected.
(iii) Neither the amount of the distortion nor the direction of the distortion wedges depend on how the sides of the display are masked. So it is not due to any kind of end effect of the sequence of dark and light tiles at the sides. The wedge distortions are therefore given by the repeated small scale asymmetrical features of the figure. (iv) The distortion is much the same for any orientation of the figure. Moulden and Renshaw (1979) find, however, small changes with the Münsterberg figure.
(v) The rectangles can have a wide range of vertical-to-horizontal length ratios. [For experiments described in this paper we have used approximate squares.]
(vi) The distortion is highly dependent on the luminance contrast of the tiles: it increases with increased luminance contrast.
(vii) The distortion occurs only when the luminance of the mortar lies between the luminances of the dark and light tiles, or at least, the mortar is not much darker than the dark or lighter than the light tiles (figure 3). The standard Münsterberg figure is a limiting and nonoptimal case where the luminances of the mortar and dark tiles are the same. The importance of what we call mortar luminance was realised by Fraser (1908).
(viii) The illusion is retained with coloured tiles (say red and green) and coloured mortar; but not when the contrasting coloured tiles have the same luminance. This dependence on luminance contrast, and loss of distortion at isoluminance was appreciated by Fraser (1908); and confirmed by Yvonne Lammerich in our laboratory, as retailed by Gregory (1977) where it is also reported that the classical converging-lines illusions show no distortion when their lines and background are isoluminant.
Figure 3. The Café Wall display, showing the basic effect of change of luminance of the mortar lines. The illusion is only present when the mortar luminance lies between, or at least is not far outside, the luminances of the dark and light tiles. The mortar width was controlled with spacers. (This model is made with squares of grey paper of two albedos, and not the white paper and retroreflecting material used in the experiment.)
(ix) The wedge distortion never reverses for any changes of luminosities. (The wedges do, however, reverse with half-cycle shifts of alternate rows of the tiles as stated in the first 'law', above.)
(x) The distortion is clearly greater in somewhat peripheral vision (cf Moulden and Renshaw 1979), or for foveal vision when the display is blurred by a weakly de-accommodating lens.
There is an indication that each tile is distorted into a separate small wedge: a problem is why these are seen as a continuous long wedge for each row, in alternate directions, though the figure has only repeated small asymmetry of the displaced tiles. (This is enantiomorphic symmetry, cf Shuhnikov and Koptsik 1974.) Similar large scale distortions from repeated small-scale asymmetries are found in many other illusions, such as the Fraser figure (Fraser 1908).
(xi) The wedge distortion occurs over a very wide range of visual angles for the display as a whole.
(xii) The distortion occurs over perhaps the entire working luminance range of the eye.
(xiii) Tile distortion occurs only for narrow mortar lines; they must not subtend more than about 10 min of arc (at high tile contrast, less at low contrast) or the illusion is lost.
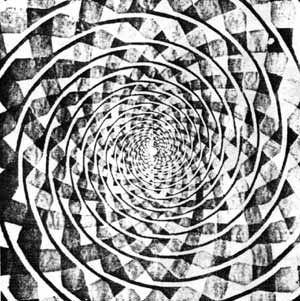
Figure 4. The apparent spiral is in fact concentric circles. This is usually regarded as evidence of visual spatial integration, in this case from misleading line elements.
1.3 Further observations
Dynamic effects occur while either the mortar-line luminance or the luminance of the tiles is varied. The bounding borders of the tiles are seen to move. They creep across the mortar during luminance changes. Though a difficult observation, it seems that the movement is greatest for the borders having the lower boundary contrast with the mortar, as the mortar luminance is varied between the tile luminances. This slight asymmetry of the shifts of the borders is more easily seen when the tiles are displaced a quarter of a cycle, to give a chessboard pattern. It is clear by using colour contrast for the mortar, that this is not merely loss of the mortar when it becomes isoluminant with the dark or light tiles.
It seems to us very important to distinguish between the dynamic shifts with luminance changes and the static displacements observed at constant luminance. They could well be effects or symptoms of different physiological processes, as, for example, static wedge distortion does not increase with mortar luminances not much darker than the dark or much lighter than the light tiles; but this is not so for the dynamic shifts, which are dramatic with extreme changes of mortar contrast. We shall attempt a functional explanation - in terms of processes that seem necessary for maintaining registration of borders. it is hoped that underlying physiological mechanisms may soon be identified, explaining how the functions are mediated.
1.4 Suggested explanation - the border-locking theory
For visual displays such as printing or television, it is technically exceedingly difficult to obtain precise spatial registration at borders, and where contrasting luminances or colours should meet without gaps or overlaps due to misregistration. These border discrepancies are annoying and confusing. Registration may be achieved by high stability of the mechanical or electronic components. but neural components are relatively labile. This problem is exacerbated by the recent finding (Zeki 1976) that visual characteristics such as luminance, colour, and movement are 'mapped' in separate cortical regions. By analogy with the display registration problem it is remarkable that vision is normally free of spurious lines, gaps. or coloured edges at borders where regions of different luminance or colour meet.
Visual registration does, however, seem to be lost in some conditions: (a) with extremely high luminance contrasts, especially at low luminance levels, and (b) for contrasting colours presented with no or very small luminance differences (isoluminance) (Gregory 1977). The former produces discrepancies during image - retina movement, which is hardly surprising, as under conditions of extreme luminosity contrast retinal receptors have very different response times, which must. during image - retinal movement, produce spatial discrepancies of retinally signalled positions. Under the conditions of isoluminant colour contrast. borders appear markedly 'jazzy' (an effect used, if unwittingly, in Op Art) and at isoluminance there is instability and there are relative shifts with movement. So we find similar phenomena for both extreme and zero luminance contrast. Why should this he so? The explanation might be sought in physiological mechanisms; but we shall suggest an explanation in functional terms, without for the moment attempting to specify a mechanism or which neural mechanism may in these conditions be upset or disturbed. It is suggested that spatial registration is normally maintained by an active system accepting border-luminance differences for locking these various features together - so that registration is normally maintained at borders. It seems to us that luminance differences provide master signals for locking, and so registering, contiguous regions of contrasting luminances and colours. We should expect a locking signal system of this kind to break down when: (a) differences in retinal delay are too great for locking to be maintained with image - retina movement; and (b) at isoluminance, when there will be no locking signals to maintain registration. We may also expect systematic distortions to be produced by locking across narrow gaps or lines of neutral luminance. It is to this we attribute the Café Wall illusion. Regions of different luminance separated by a neutral gap, not wider than the range of the locking signals, should be pulled together by the locking normally serving to maintain registration in spite of the lability of neural components, and the different response times associated with different luminances (as demonstrated with the Pulfrich Pendulum; and, for the colour systems, by Benham's disk).
It is suggested that the 'laws' of the Café Wall illusion describe functional properties of the proposed border-locking system. If this is so, the observed distortions and dynamic shifts can be used to demonstrate and measure functional characteristics of the border-locking system; and to discover the limits over which it works appropriately before it allows, or generates, errors appearing as illusory phenomena.
In this study we consider effects of width and luminance of the separating mortar lines; and of contrast and mean luminances of the dark and light tiles. For these measurements, art apparatus was designed and built to vary the luminances and the width of the separating mortar lines over wide ranges, in order to discover the limiting conditions for the distortion to occur and to measure the amount of the distortion under various conditions. The distortions were measured with a simple matching technique.
2 Method
2.1 Apparatus
The following variables could be controlled and the effects measured:
(a) Width of the dividing mortar lines.
(b) Luminance of the mortar lines.
(c) Luminance contrast of the dark and light tiles.
(d) The offset of alternate rows of the tiles (allowing the display to be changed, continuously, to a chessboard with variable-width mortar lines between each row of tiles).
(e) Colour could also be controlled, though this will not be discussed here. [The illusion disappears with isoluminant coloured tiles. cf 'law' (viii).]
(f) The wedge distortion was measured by adjusting and matching a pair of variable-convergence lines, surrounded by a circular aperture placed immediately above the Café Wall display (figure 7).
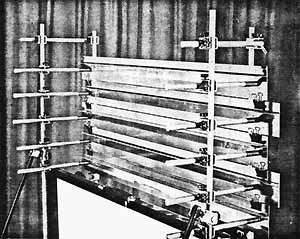
Figure 5. Back view of the main display, showing the aluminium strips retained with springs against the vertical frame supports. The mortar-line gaps are set with spacers placed on top of the retaining bulldog clips.
Five accurately parallel strips of aluminium, 7.5 cm wide and 92 cm long, were cut with a precision guillotine. They were made rigid with aluminium strips bent to an L-shape and glued along their length. The strips were mounted as shown in figure 5. They were free to slide sideways, and were kept in place with light pressure from compression springs which held them against the front two vertical rods of the support frame. Alternate dark and light tiles, 7.6 cm wide, were stuck onto the strips. The aluminium strips of tiles were spaced apart to give any required mortar-line width, with shims (or coins) placed between the strips, as shown in figure 5. This display was masked by a black rectangular surround showing eight tiles per row. (This seems preferable to a circular mask as the figure is of special interest, through having only parallels and right angles. A circular surround was however used for the matching lines in order to avoid comparison horizontals.)
The mortar-line luminance was given by Variac-controlled slide projectors illuminating a diffusing screen behind the display strips. Since these were opaque, only the gaps between the strips, giving the mortar lines, were illuminated by these back projectors. The colour temperature changes were regarded as acceptable.
For these experiments it was important to provide a contrast range as wide as possible between the dark and light tiles; and to ensure that the mortar lines could be set not only to any luminance over this range, but significantly darker than the dark tiles or lighter than the light tiles. To make it possible for the mortar to be darker than the dark tiles, these were made of white paper. This required that the light tiles be made of a material having very high reflectance, for it was important to provide as high as possible luminance contrast between the dark and light tiles.
This was achieved by making the light tiles of retroreflecting material, having very closely spaced microscopic corner cubes. This gives effective autocollimation, the incident light being reflected back to the source, as in 'cat's eyes'. We therefore obtained virtually the source intensity for the luminance of the white tiles, and a variable luminance contrast ratio between the dark and light tiles greater than could perhaps be attained in any other way.
There were two ways available for adjusting the contrast between the dark and light tiles. First, since the retroreflecting material does not depolarize the incident light, we could employ variable-angle cross polarization. This, however, hardly gives a range of one order of magnitude, and we were anxious to explore a wider range of luminance. Moreover, it has the disadvantage that the subject must view the display through a polarizing filter, with considerable optical loss due to scatter. So this method was not adopted.
Figure 6. Layout of display apparatus. The observer (left) views the display monocularly. The pair of on-axis projectors are provided with right-angle prisms in order to reduce the separation as much as possible. (Beam splitting was not used as this introduces scatter and glare.) The pair of off-axis projectors were in fact above and below, respectively, for lack of space. They served with the on-axis projectors to give variable contrast between the dark and light tiles, owing to the different directional reflectance characteristics of the white paper (the dark tiles) and the retroreflecting material (the light tiles). This is explained in the text. The three projectors at far right provide the mortar-line illumination, with trans-projection of the screen behind the display. (Three projectors are used to minimise the 'hot spot' from the central projector, which is endemic to trans-projection.)
The second method open to us may be novel. It made use of another feature of the retroreflecting material: its highly directional reflectance. To obtain the greatest luminance, a pair of light sources (slide projectors) were placed as close together as possible either side of the viewing position (figure 6). The bright tiles were then very nearly as bright as the sources. We arranged a second pair of projectors at an angle of about 25? each from the viewing line, so that the efficiency of the retroreflecting material was, for these, greatly reduced; though the luminance of the dark tiles made of white paper remained almost unchanged, as paper does not have directional reflectance. With this second pair of projectors the retroreflecting material was actually darker than the white paper, normally producing the dark tiles, when the two sets of light sources were set to equal intensity. This made it possible to reduce contrast, not only to zero, but to cross the isoluminance point by varying the intensity ratio, continuously, of the on-axis and off-axis projectors. The tile contrast was thus set by using both pairs of projectors simultaneously. The range went from zero (or actually from reversed contrast) up to about 0.94, where contrast is taken to be
(L max - L min) / (L max + L min).
It is important, though it was by no means easy, to obtain uniform illumination for the tiles and the mortar. This was achieved mainly by using high-quality slide projectors with aspheric condensers. Since it is essential to be able to set the mortar luminance above the luminance of the light tiles at their maximum, and the retroreflection of the light tiles was far more efficient than the trans-illumination used for the mortar, there was no point in providing the brightest possible front projectors for the tiles. These were illuminated by two pairs of high-quality 150 W Leitz Pradovit projectors. The mortar was given by back projection, from a centrally placed Aldis 250 W projector, with a pair of 150 W projectors angled to give the most even illumination, as there is an inevitable 'hot spot' with back projection from the central projector. The back-projection mortar illumination might have been increased with advantage, to allow a still greater useful light-tile luminance for the extreme conditions of the experiment. Floodlights can be used to increase mortar luminance.
 |
 |
| Figure 7. The subjects' view of the Café Wall apparatus | Figure 8. The adjustable convergence lines for measuring the wedge distortion by matching. The lines consist of a wire whose ends are attached symmetrically either side of the centre of the large wheel, and pass over a pair of pulleys. As the large wheel is rotated the ends separate, or meet, and so the convergence changes. |
Measures of the wedge distortion were obtained by matching the (apparent) wedge angle with a pair of lines, adjustable in convergence, placed within a circular mask situated immediately above the Café Wall display (figure 7). The lines were in fact a single wire passing over a pair of pulleys, on the right side, having a fixed separation of 60 mm. The variable convergence, set by the subject, was given by the simple mechanism shown in figure 8. It was measured for each setting from magnified shadow-images of the wires, produced by a point source placed slightly above the wires and in front to cast their shadows by reflection from a vertical mirror placed behind the display onto the back of a translucent screen bearing the ruler. This arrangement made it possible to measure the separation, and so the convergence angle of the wires easily and accurately, for parallax errors were avoided with the shadow-images. By adjusting the distance of the vertical mirror the scale was magnified, exactly by a factor of two, to give the optimum movement of the wire images at the ruler, which was placed conveniently close to the experimenter, though the wires were hardly accessible for direct measurement. This kind of arrangement may be recommended for wider application.
2.2 Luminance calibrations
An S.E.I. spot photometer was placed at the viewing aperture to measure the luminance of:
(i) the back projection (mortar lines) at various voltage settings of the trio of projectors, with all other projectors switched off;
(ii) the dark and light tiles at various voltage settings for the pair of on-axis projectors, with the other projectors switched off;
(iii) the dark and light tiles at various voltage settings for the pair of off-axis projectors set 25? from the line of sight, with the other projectors switched off.
Calibration graphs were drawn for each of these, for deriving luminance values from the measured voltages under each condition. (It turned out to be necessary to measure the luminance of large sheets of the tile material, rather than individual tiles of the Café Wall itself, as light from neighbouring bright tiles produced significant errors by scattering of light within the photometer.)
2.3 Procedure
The subject's head was loosely restrained with a chin rest. The monocular viewing position, which is critical for this method (though not so critical as Maxwellian viewing), was determined by a 30 mm viewing aperture. The viewing distance was 2 m. Foveal fixation, with unlimited exposure time and free eye movements, was employed throughout so that the eye could be used as normally as possible. (In our experience peripheral vision is very difficult and fatiguing for subjects; and it is almost impossible to avoid 'cheating' with foveal fixations unless tachistoscopic exposures are employed. hut with these the eye is not used normally.) The distortion is. however, greater for peripheral vision, as Moulden and Renshaw (1979) report for the Münsterberg illusion. Comparison of the wedge distortion with the adjustable-convergence-angle lines was made sequentially, by looking up from the main display to the adjustable convergence lines above it, without changing the head position or moving the eye from the viewing aperture, as both the Café Wall display and the comparison lines were comfortably in view from this position.
Two kinds of responses were obtained: (a) matches of the distortion seen on the central row of tiles with the variable convergence matching lines: (b) verbal reports of the extent of distortion, without reference to the matching lines, on a four-point scale: 0 - for no distortion: 1 - for fleeting distortion, usually seen in peripheral vision, and generally associated with large eye movements; 2 - for a standing weak illusion, on the central row with foveal vision: 3 - for a standing set of alternate wedge distortions seen over the entire display without eye movements.
The five subjects used for the main experiment viewed the display with optical correction, when necessary with a selected trial lens placed in the viewing aperture. The Café Wall was set up at a 90? phase angle between alternate rows as shown in figure 7.
There were five conditions of luminance of tile contrasts.
I. zero (isoluminance) between the usually 'dark and 'light' tiles:
II. a dark - light contrast of 0- 11;
III. a dark - light contrast of 069;
IV. a dark - light contrast of 0-94;
(These were all presented with a light tile luminance of 86 cd m-2.)
V. the 0.94 dark - light contrast presented at a light-tile luminance of 7.6 cd m-2.
For each of these five luminance conditions, the subjects were presented with six values of' mortar width, subtending to the eye: 1, 2.7, 4.4, 6.1, 9.5, or 12.9 mm. These were presented at various luminances of the mortar lines: isoluminant with the dark or the light tiles, and at various intermediate luminances. Luminances outside this range were presented when necessary for establishing the upper and lower mortar luminances at which the wedge distortion disappeared.
3 Results
Figure 9. The Café Wall illusion (Estimates on the left, Measures by matching on the right) for six mortar-line widths. The light-tile luminance of A and B is 7.6 cd m-2 and of C to H is 86 cd m-2. The tile contrasts are: for A, B, G, and H, 0.94; for C and D, 0.11; for E and F, 0.69. The arrows on the absissae indicate critical mortar luminaces (from left to right): isoluminance with the dark tiles; various intermediate values; isoluminance with the light tiles. Each point is the mean of five subjects. Error bars show the maximum and minimum standard deviations.
The illusion decreases with increase in mortar line width (from 1 mm to 12.9 mm of arc subtended at the eye). The range of mortar luminances giving significant illusion decreases with decreased tile contrast, and decreases with increased mortar width. For mortar widths greater than 4.4 mm of arc, the illusion is greatest at mortar luminances intermediate between the dark-tile and light-tile luminances. Very little illusion occurs with mortar widths greater than 2.7 mm of arc when the mortar is darker than the dark, or lighter than the light tiles. For widths less than 2.7 mm of arc, illusion can occur somewhat beyond isoluminance with the tiles: especially at low tile luminances with high contrast; and, less markedly, for high tile luminance with low contrast.
The results are shown in figures 9 and 10. Separate graphs have been drawn for subjects' rating of the illusion, and for their setting of the adjustable wires to match the wedge distortion. These two measures are in close agreement. Figure 9 shows how the magnitude of the illusion varies as a function of mortar width and of luminance for four of the conditions. When the tiles were isoluminant there was no illusion, as Yvonne Lammerich found (Gregory 1977). (Contrasting coloured tiles can be produced with, say, red and green filters in the on-axis and off-axis projectors respectively.) Figure 9 shows the mean scores for the five subjects. The maximum and minimum standard deviations are shown for each border width. The other standard deviation values have been omitted from these graphs for the sake of clarity. It can be seen that:
(i) As the mortar width is increased beyond 1 mm of arc the maximal distortion decreases, Very little distortion is seen (at least for most people with good visual accommodation) with mortar widths greater than 10 mm of arc subtended at the eye. (ii) As the mortar width is increased beyond 1 mm of arc, the upper and lower limits of the mortar luminance at which the illusion is elicited decrease. At about 8 mm of arc the mortar luminance must lie rather precisely midway between the dark-tile and light-tile luminances for the illusion to appear.
(iii) For the illusion to occur, the mortar luminance must not be significantly lower than the dark-tile luminance or higher than the light-tile luminance. With increasing contrast between the dark and light tiles, tile range of acceptable mortar luminance increases. At isoluminance of the tiles there is no mortar luminance which gives the illusion. The illusion is generally judged as less compelling for any mortar luminosity at low (0.11) tile contrasts. There is evidence that the maximum width of the mortar giving the illusion falls with reduced tile contrast- As can be seen from figure 9, there is practically no change in the maximum mortar width giving the illusion over the contrast range 0.94 - 0.69, but the maximum is reduced for the range 0.69 - 0.11.
(iv) When the luminance of the light tiles is reduced from 86 cd m-2 to 7.6 cd m-2 there is little change in the observed distortion; but the measures (figure 9) show a small increase with the lower luminance.
Figure 10. The horizontal bars show the range of mortar luminance over which illusion occurs (from verbal reports of five subjects). Graphs A and D show the effect of the high tile contrast of 0.94. Graph B shows the effect of the low tile contrast of 0.11. Graph C shows the effect of the intermediate contrast of 0.69. The light-tile luminance of A is 7.6 cd m-2 and B to D, 86 cd m-2.
It is clear that the range of mortar luminance over which the illusion occurs decreases as tile contrast decreases; and decreases with increase in the width of the mortar lines.
4 Discussion
4.1 Is the illusion inappropriate border-locking?
This illusion is not as easy as many others to measure. When the illusion was at its strongest, matching with the variable convergence lines presented no special problems, except that the region of maximum apparent wedge angle may be less than the total length of the rows of the tiles. For the conditions giving a weaker illusion there was considerable perceptual ambiguity, the tiles sometimes appearing as separate wedges, and sometimes the rows of tiles would appear to tilt around a vertical axis in depth. The illusion was, at least when weak, affected by eye movements and it tended to fade with prolonged viewing. It is markedly affected by accommodation errors, being greater when blurred.
The smallest mortar width we have used is 1 mm of arc. Narrower widths should be examined. We find that the narrowest mortar lines we have used give the most pronounced illusory distortions. This may he surprising if we think of the distortion as simply a sucking by the locking system of the contours across the mortar; hut there is another consideration. It seems that the locking signals are drawn from fairly large regions (have low spatial frequency characteristics), so for narrow mortar lines, or other lines or borders, the effective region from which the locking signals are drawn may extend from behind the border. (We may describe this as the 'hinterland effect'.) This could explain the distortion persisting for narrow mortars somewhat darker or lighter than the tiles. It can also explain why there is any distortion in the limiting case of the Münsterberg illusion where the mortar line is lost, as it is isoluminant with the black tiles. Here the different widths of the black regions bordering the white tiles - the thin black lines and the much wider black tiles - serve to give this illusion: as they must do because they are the only asymmetry in the figure (see the caption to figure 12).
The curves shown in figure 9 have systematic asymmetries The high-contrast conditions (A. B. G, and H) show that the illusion occurs at greater widths of the mortar when its luminance is equal to that of the dark or the light tiles. Possibly this is due to the 'hinterland' behind the border contributing to the locking being greater at low luminances, which is to be expected as receptive field size increase with decreased luminance. For the low-contrast displays (C, D, E, and F) narrow mortar lines give large illusions when the mortar luminance is greater than iso-luminance with the light tiles. It is not obvious how the border-locking model should account for this.
The finding that illusion decreases at the low contrast of 0- 11 as compared to the higher contrasts of 0-69 and 094 is in close agreement with the finding, in their experiment 6, of Moulden and Renshaw (1979). However, we find a small increase in illusion when the luminance is decreased from 86 to 7'6 cd m-2. whereas Moulden and Renshaw in their experiment 5 found a decrease in illusion for a similar decrease in luminance. This difference may be due to the different contrasts of the displays: ours was 0.94 and theirs was presumably unity (as they used various back projection luminances with opaque. and so black, squares).
A reason for measuring the wedge distortion under various conditions is that it is an amplification of border shifts which are small and difficult to measure directly. especially under a variety of conditions. It is, however, not clear that the large-scale wedge distortion is a linear amplification of the tile-sized border shifts, or what the amplification factor is; though the amplification characteristics could be established from a knowledge of individual border shifts, which have indeed been measured under some conditions by Moulden and Renshaw (1979).
4.2 How is the Café Wall related to the Münsterberg illusion?
The Münsterberg figure is a special case of the Café Wall illusion, where the mortar lines are isoluminant with the dark tiles which are drawn as black rectangles (figure 2). So there are no gaps, or neutral lines, for the locking to draw borders across. Why, then, should the wedge distortion of the Münsterberg illusion occur?
Consider figure 11. There is repeated small-scale asymmetry (as in the Café Wall though with non-isoluminant mortar lines), for the white rectangles (analogous to the light tiles of the Café Wall figure) are bounded for half their length by narrow black lines, and for the other half by wide black lines - the black rectangles. The border-locking model implies that the white - black regions are locked at their common boundary: but the different widths of the black lines and the black rectangles may give different locking signals. We might expect the wide rectangles to give stronger locking signals than the narrow lines (cf the 'Hinterland' suggestion, section 4. 1) but what is not clear is why this difference in the strength of locking signals produces the distortion in the observed direction. To explain this, we need an additional concept: perhaps that white is pulled into the black. This asymmetry would be visual: quite different of course from asymmetries of the figures. The visual asymmetry is Helmholtz's 'irradiation'. It is very interesting that the Café Wall with neutral mortar does not follow 'irradiation': for the black-tile borders are shifted into the lighter mortar. 'Irradiation' lacks a satisfactory functional or mechanism explanation. We have suggested that border locking gives a functional modus operandi for these border shifts: but a complete explanation requires details of the physiological mechanisms and their functional range which may not be optimal.
Figure 11. Explanation of the Münsterberg
illusion.
This is a limiting case of the Café Wall illusion, where
the mortar lines are isoluminant with the dark (black) tiles,
The distortion cannot now be due to locking across neutral gaps
of mortar for there are no such gaps here. We suggest that border
locking is affected by luminances in regions immediately behind
borders ('hinterland' catchment area, presumably given by receptive
fields). When the wide black rectangles fill the catchment area,
but the black lines are too narrow to fill it, the locking should
be greater at b where the white tiles border wide black tiles.
If we assume that white is pulled into black, by border locking
(as in Helmholtz's 'irradiation' effects), then perhaps we understand
why the white tiles seem to be pulled more into the black at b
that at a - to give the observed direction of distortion.
4.3 Is border locking retinal or cortical?
The Café Wall, as for the Münsterberg illusion, is wedges alternating in the direction of convergence for each row of tiles, If we suppose (and indeed this can be seen by changing the mortar luminance) that the half of each tile which faces a contrasting luminance region across the mortar is shifted towards meeting - though, at least for wide mortar lines, not quite to touch - the opposing border of contrasting luminance, then it is clear that each tile should be distorted to something like a wedge. The tiles should all have wedge distortions in the same direction for each row, and the direction of the wedge convergences should reverse for each alternate row. This should be clear from figure 1 2. Under some conditions, especially when the display is blurred, each tile is seen as a separate wedge, rather than as sections of row-long wedges. It was supposed by Fraser (1908) that such large-scale asymmetries are produced by spatial integration of each small-scale distortion (or, for the Fraser figures, misleading line elements), but it is also possible that constancy scaling is set inappropriately by the tile-sized wedges. which would be a more central process.
If the border locking normally serves, as we suppose, to maintain registration for regions of different luminance and also for different colours, from the border luminance signals, then luminance locking could be early in the visual channel: but the cortical colour-locking must be cortical - at or after the cortical maps described by Zeki (1976).
Figure 12. Explanation of the Café
Wall illusion
The 'blow up' indicates how border locking may work to give the
Café Wall illusion when the mortar lines lie within, or
are not significantly outside, the dark - light tile luminance
range. It is suggested that spatial registration is normally maintained
by signals from luminance transitions. locking contrasting luminance
and also colour regions together at common signalled borders.
This is supposed to prevent registration errors in most conditions,
but to create distortions when locking operates across neutral
gaps or lines. Thus, for the Café Wall illusion, the dark/light
tile borders would be pulled together across the neutral mortar
line where the luminance differences are large on opposite sides
of the mortar. The dark and light tile borders should each lock
onto their own side of the neutral mortar line except when there
is a strongly contrasting luminance on the other side, to capture
the boundary and pull it across the mortar. When the mortar luminance
is significantly greater or less than the luminance of the light
and dark tiles respectively, locking will no longer occur across
the mortar lines, for there will now be contiguous contrast borders
along the whole length of each tile on their own side of the mortar.
When the tiles are displaced by half a tile width in alternate rows, the locking across the mortar only occurs where half a light tile faces half a dark tile (b in the figure). Where the light halves face, and where the dark halves face, the locking will not be across the mortar, but only on their own tile - mortar borders (a and c in the figure). There are therefore different locking signals along the length of each bright and dark tile, producing wedge-like distortion of the tiles.
The row-long wedges observed may be due to spatial integration (Fraser 1908; Moulden and Renshaw 1979); or they may be due to setting up (inappropriate) depth-size scaling as has been suggested for example for the Zollner illusion (Gregory 1974).
It is, however, clear that the wedge distortion is considerably affected not only by luminances and mortar width but also by the sharpness of the retinal image and its location on the retina: the illusion increases with blur, and with peripheral rather than foveal vision. It does not, however, follow that the illusion must be retinal in origin, for these differences may change the kind of signals received for cortical locking. One might think the issue could be decided by stereoscopic experiments applying Julesz's (1971) paradigm, in which one eye is presented with insufficient information and the other with the needed remainder. Since neither eye's image is adequate, there must be central binocular synthesis. If this illusion occurs with binocular synthesis of the tiles in one eye and the mortar in the other, there must be a cortical component, at or after binocular synthesis. We have, however, reservations over applying this paradigm here, for not only are the stereo pairs of the Cafe-Wall-like display difficult to fuse because of rivalry, but, much more fundamental, it may be that the stereo signals from retinal disparity are taken off before the border locking. This would be a good design feature, for, though border locking would help object recognition by avoiding spurious gaps and lines due to misregistration, the distortions which must occur in order to achieve locking would, when horizontally opposed in the two eyes, produce disparity errors which would upset stereo-signalled depth. Since but small disparities serve to signal stereo depth, small horizontal distortions should have devastating effects on stereo vision. A later paper will report evidence that the retinal signals accepted for stereo are not the same signals as those giving the shifted borders of these illusions. If the stereo signals are not affected by border locking, then we cannot apply the Julesz paradigm for deciding whether these shifts have a retinal or a central origin.
Acknowledgements
We thank the Medical Research Council for their support of the Brain and Perception Laboratory, Dr Mark Georgeson for helpful comments, and Philip Clark for photographic and technical assistance. We would like to thank our subjects for their patience.
References
Fraser J, 1908 "A new visual illusion of direction" British Journal of Psychology 2 307 - 320
Gregory R L. 1973 "The confounded eye" in Illusion in Nature and Art Eds R L Gregory, C E Gombrich (London: Duckworth) pp 49-95
Gregory R L, 1977 "Vision with isoluminant colour contrast" Perception 6 113-119
Julesz B 1971 Foundations of Cvclopean Perception (Chicago: University of Chicago Press)
Moulden B, Renshaw J, 1979 "The Münsterberg illusion and irradiation" Perception 8 275 - 301
Shubnikov A V, Koptsik V A, 1974 Symmetry in Science and Art (New York: Plenum Press)
Zeki S M, 1976 "The functional organization of projections from prestriate visual cortex in rhesus monkey" Cold Spring Harbour Symposium on Quantitative Biology 40 591 -600
Received 1 August 1979
© 2001 Richard Gregory and Priscilla Heard
![]()